Data consulting for strategic impact
Our team of MBAs at USC Marshall specializes in data strategy, analysis, and reporting, harnessing powerful tools to deliver impactful insights.
We turn data into strategic, actionable insights for your business.
Case study
Using data analytics to uncover the drivers of obesity
Using data analytics, we helped a health tech company uncover key predictors of obesity, like family history, age, and lifestyle factors. Our analysis showed that family history and snacking habits have a major impact on BMI, guiding the company to create targeted interventions like personalized health plans and focused outreach to high-risk groups.
Exploratory analysis and correlation
Incorporating heart disease data and descriptive statistics
Identifying the strongest predictors of obesity
Logistic regression, rapid predictive model, and actionable insights
Neural network, PROCs, GCP, and beyond
Our data-driven approach equips the company to create targeted strategies for combating obesity and promoting health. With insights into obesity’s key factors, they can design impactful, tailored interventions.
Phase 1: Foundational data
Phase 1 establishes the foundation for a comprehensive obesity analysis, defining the project goals, selecting key datasets, outlining the analysis plan, and specifying dependent and independent variables.
The comprehensive, structured approach ensures a robust investigation into obesity and its related factors. Insights from this phase will shape effective strategies and interventions to tackle this pressing health issue.

Dataset selection
We selected 3 datasets to cover a wide variety of independent variables that could affect obesity.
- Estimation of Obesity Levels Based on Food Consumption* (Kaggle) – the main dataset examining the link between food consumption and obesity levels.
- Youth Risk Surveillance System (Kaggle) – offers insights into behaviors and risk factors tied to obesity in young people.
- CDC Nutrition, Physical Activity, and Obesity – CDC data on nutrition, physical activity, and obesity prevalence.
Dependent variable definition
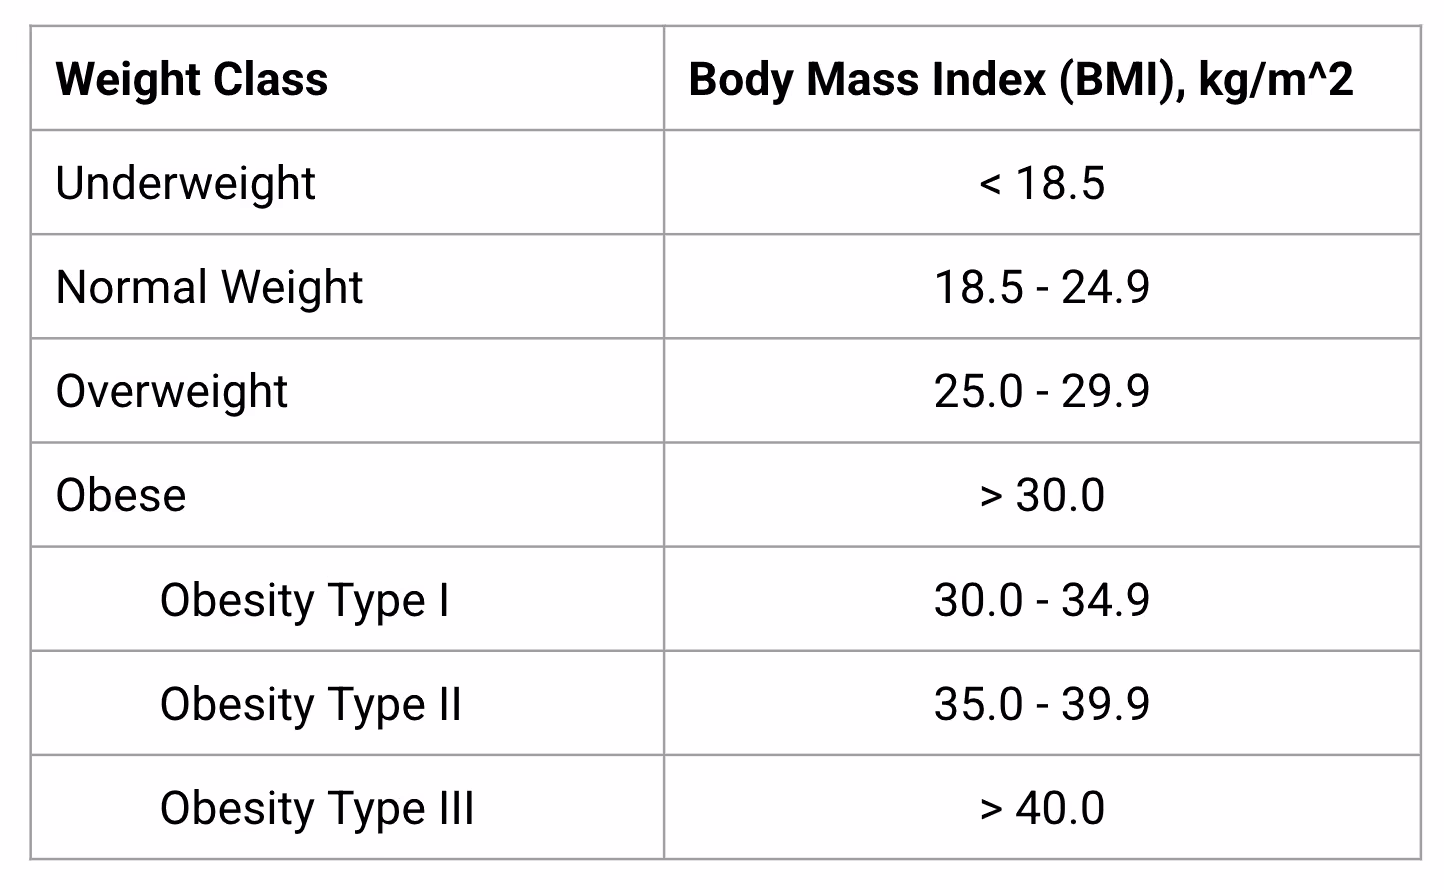
Our dependent variable is Body Mass Index (BMI), as defined by the ranges above.
Independent variable definition
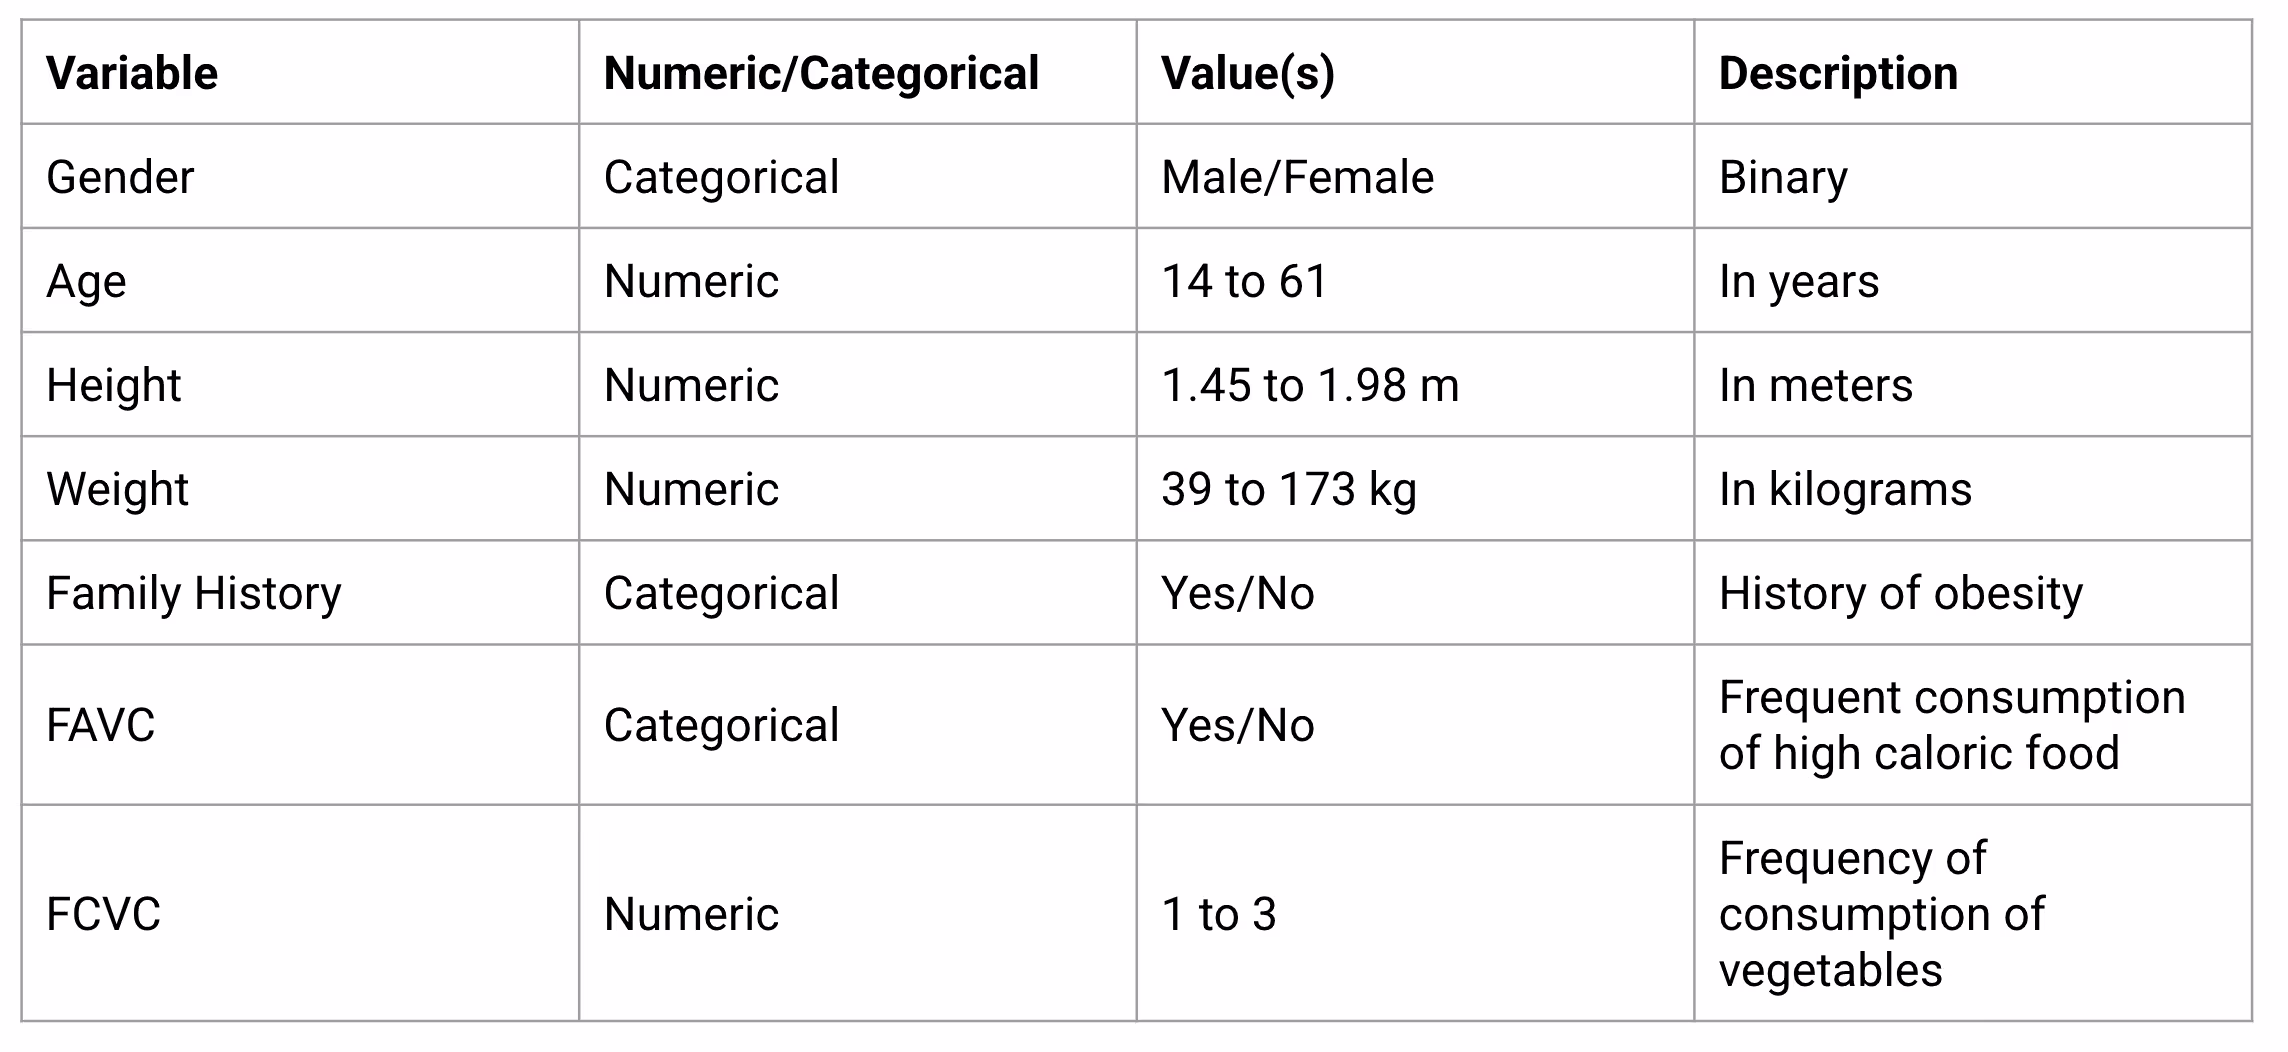
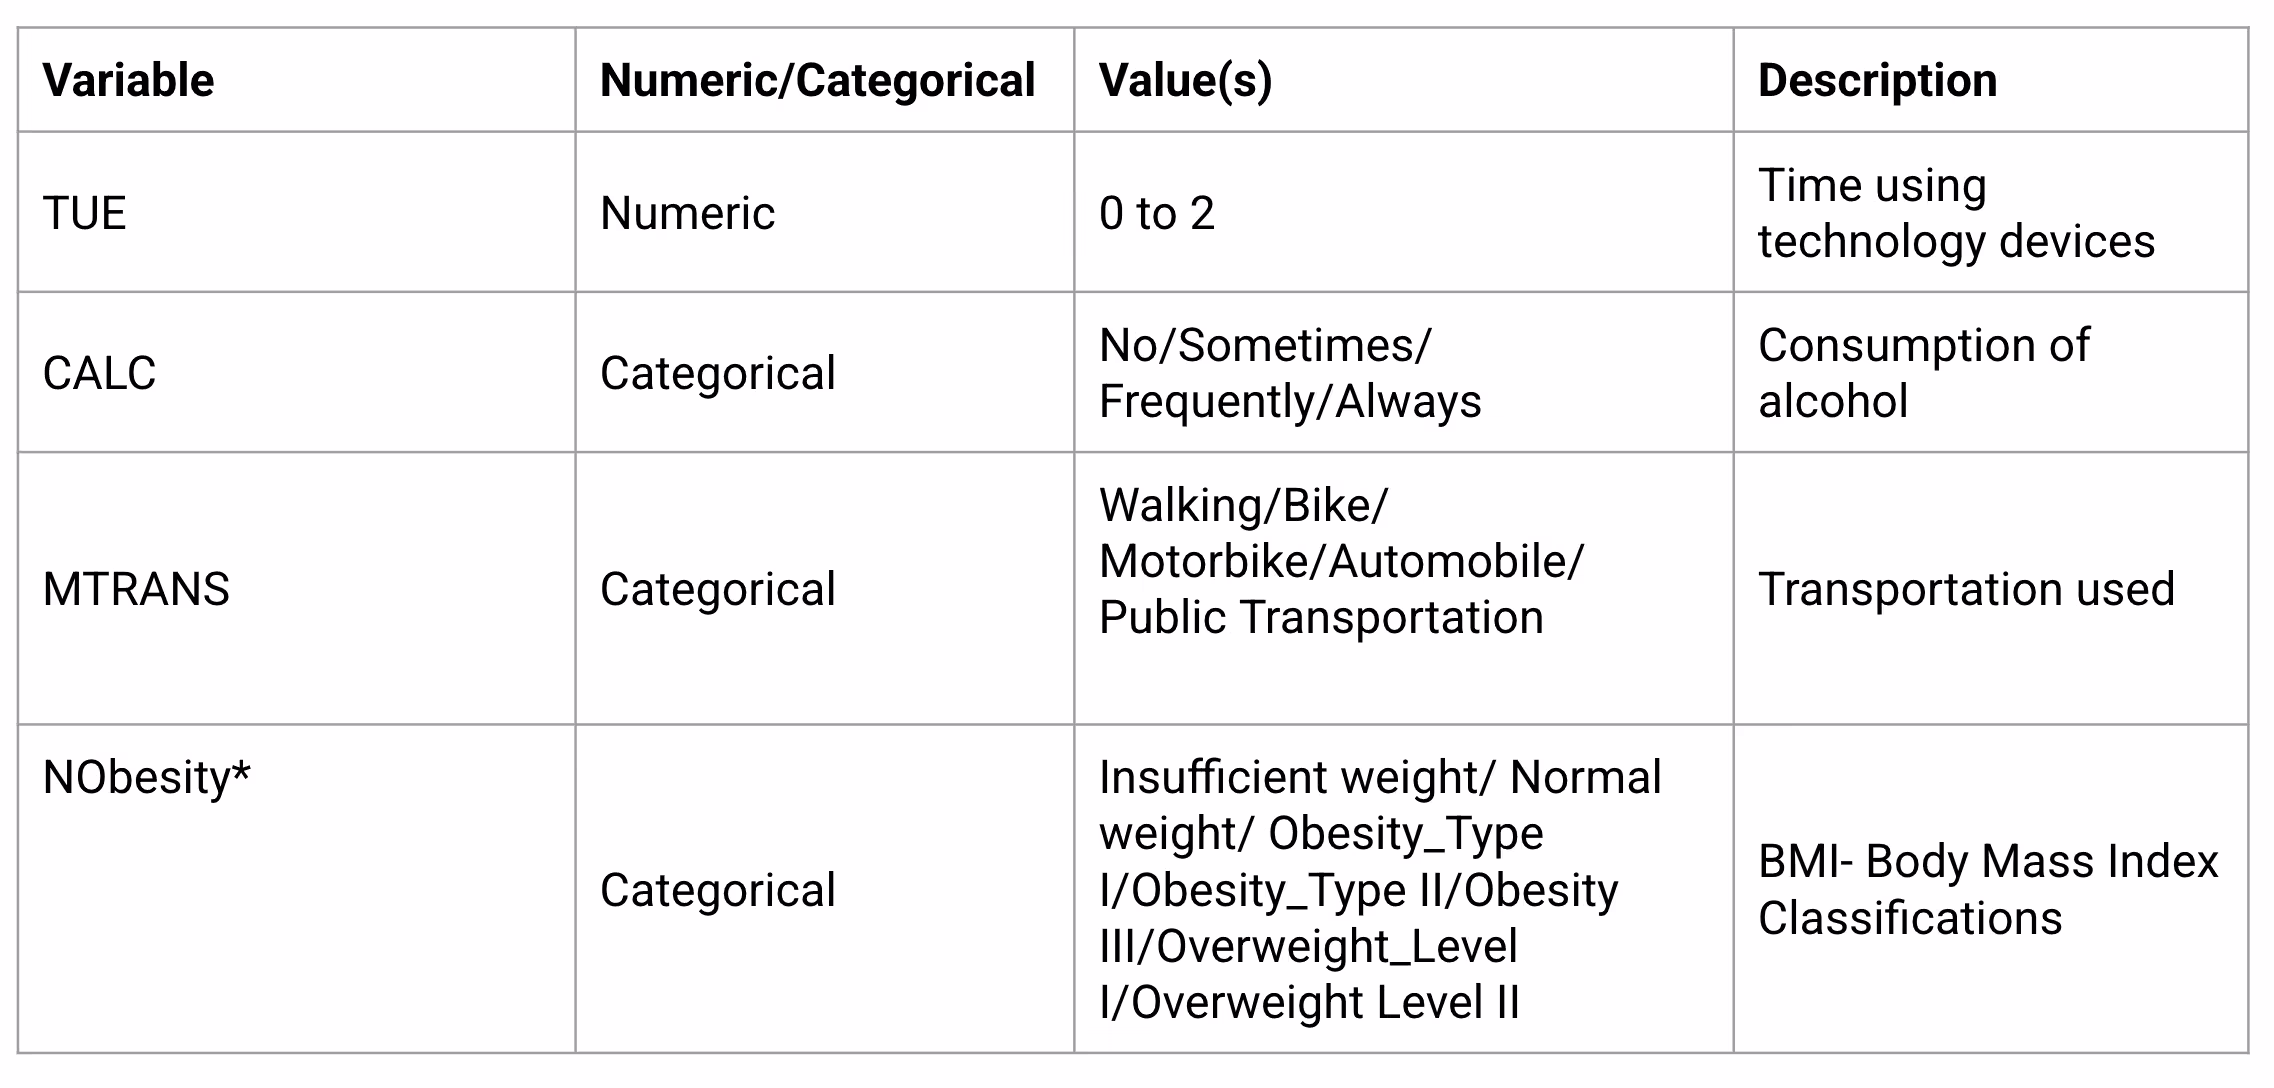

The analysis includes a comprehensive list of independent variables, categorized as numeric or categorical, with defined ranges and descriptions. Key variables include demographic and lifestyle factors like gender, age, height, weight, and family history of obesity. Dietary habits, such as high-calorie food consumption (FAVC), vegetable consumption frequency (FCVC), and daily meals (NCP), are also examined. Additional factors include physical activity (FAF), water intake (CH2O), smoking history, calorie monitoring (SCC), technology use (TUE), alcohol consumption (CALC), and preferred mode of transportation (MTRANS). BMI classifications (NObeisty*) provide obesity insights, following standards from WHO and Mexican guidelines.
Phase 2: Statistics
In Phase 2, we expanded our analysis by incorporating heart disease data to explore its link with BMI severity. We calculated descriptive statistics and used visuals to highlight key correlations with variables identified in Phase 1.
Phase 2 analysis and visualizations highlighted key obesity correlations with factors like family history, calorie awareness, activity levels, technology use, transportation, water intake, and age. These insights set the stage for Phase 3, where advanced techniques will pinpoint top predictors and inform actionable recommendations.
Variable correlations

TUE (technology usage) shows no direct correlation with BMI or FAF (physical activity), but an inverse relationship exists between FAF and BMI, indicating that lower physical activity levels are associated with higher BMIs. Individuals with higher BMIs generally exercise less than once or twice a week.
Family history as a predictor of obesity

We found that study participants with an obese parent or grandparent had a significantly higher risk of obesity themselves.
Phase 3: Predictors of obesity
The goal of phase 3 was to explore the correlation between obesity and various factors to develop impactful product and awareness recommendations for a health technology company. The team focused on understanding the strongest predictors of adult obesity and identifying the lifestyle and dietary habits that individuals can control, assessing their impact, and providing guidance on making healthy choices to prevent obesity.
We identified key predictors of adult obesity, such as lifestyle choices (physical activity, vegetable consumption, water intake) and demographic factors (age, family history). These insights pave the way for developing impactful products and strategies to prevent obesity and promote healthier living.
BMI Index linear regression with numeric variables
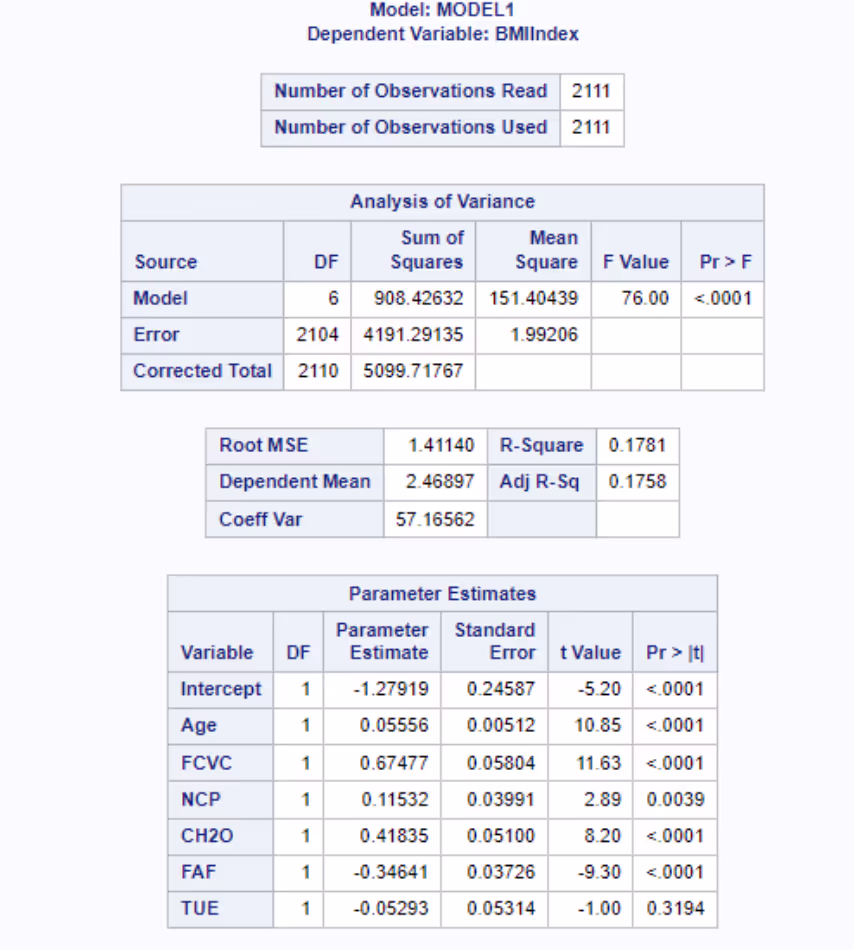
The model is statistically significant (p < 0.0001), with an R-square of 17.8%, indicating that 17.8% of the BMIIndex variance is explained by the model. Significant predictors include age, vegetable consumption (FCVC), meals per day (NCP), water intake (CH2O), and physical activity (FAF), while technology usage (TUE) has no significant effect.
BMI Index ANOVA
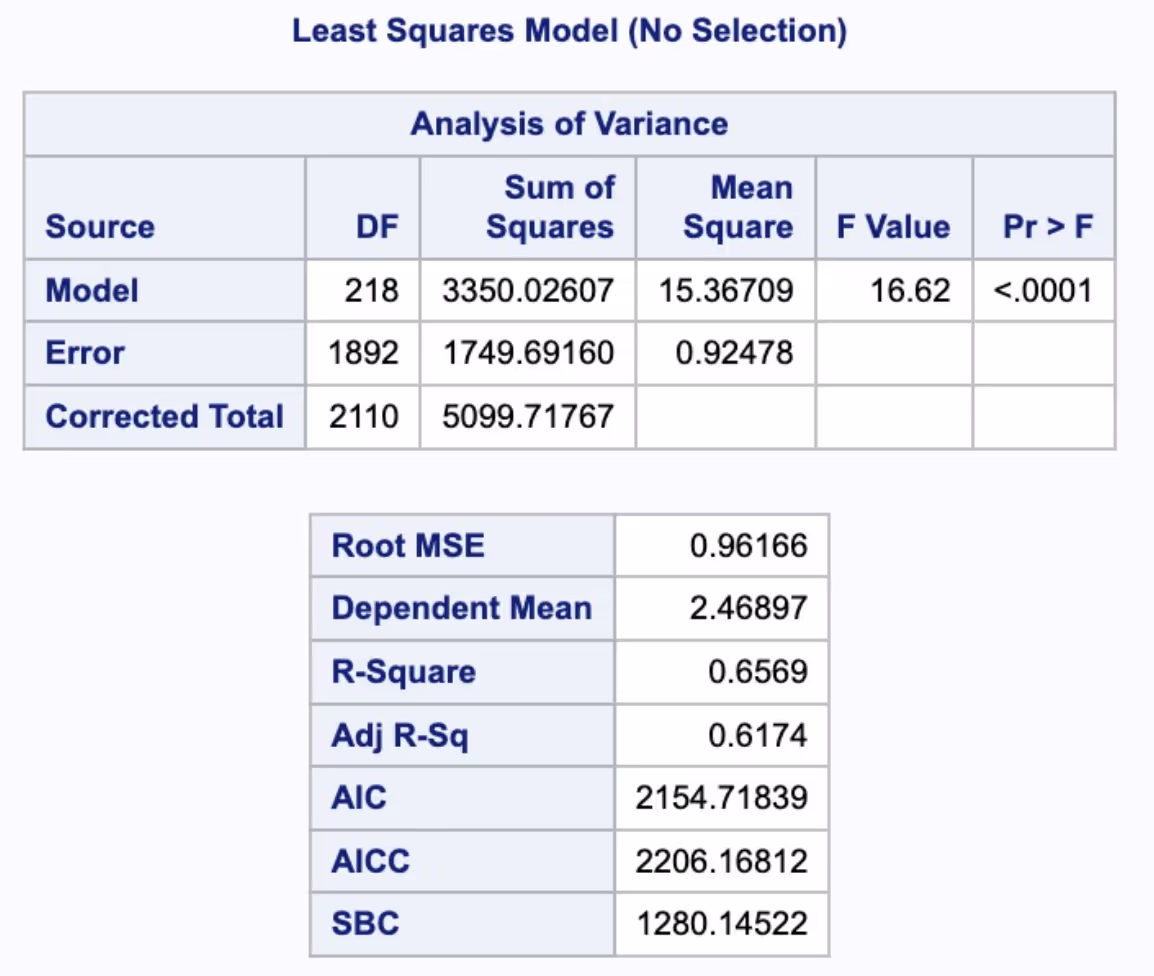
Our model shows a highly significant F-statistic (16.62, p < 0.0001), providing strong evidence that it explains a substantial portion of BMIIndex variance. Testing all 8 categorical variables, we achieved an R-square of 0.6569, indicating that around 65.7% of BMIIndex variance is explained, confirming a strong model fit. The adjusted R-square supports this result.
Phase 4: Model
In phase 4, the analysis was expanded to include logistic regression and a rapid predictive model (RPM) to better understand and predict obesity risk. The team focused on identifying key predictors of obesity and developing a model that effectively predicts obesity risk, particularly in high-risk individuals.
ROC Curve

The ROC curve has an AUC of 0.7842, which indicates a 78.42% confidence in distinguishing between obese and non-obese cases. This is considered well above random chance (0.5) and suggests the model strongly distinguishes between the two classes. An improvement in accuracy was achieved by adding numerical variables of age, FCVC (vegetable consumption), NCP (number of meals per day), CH2O (water intake), and FAF (physical activity frequency).
Cumulative lift chart
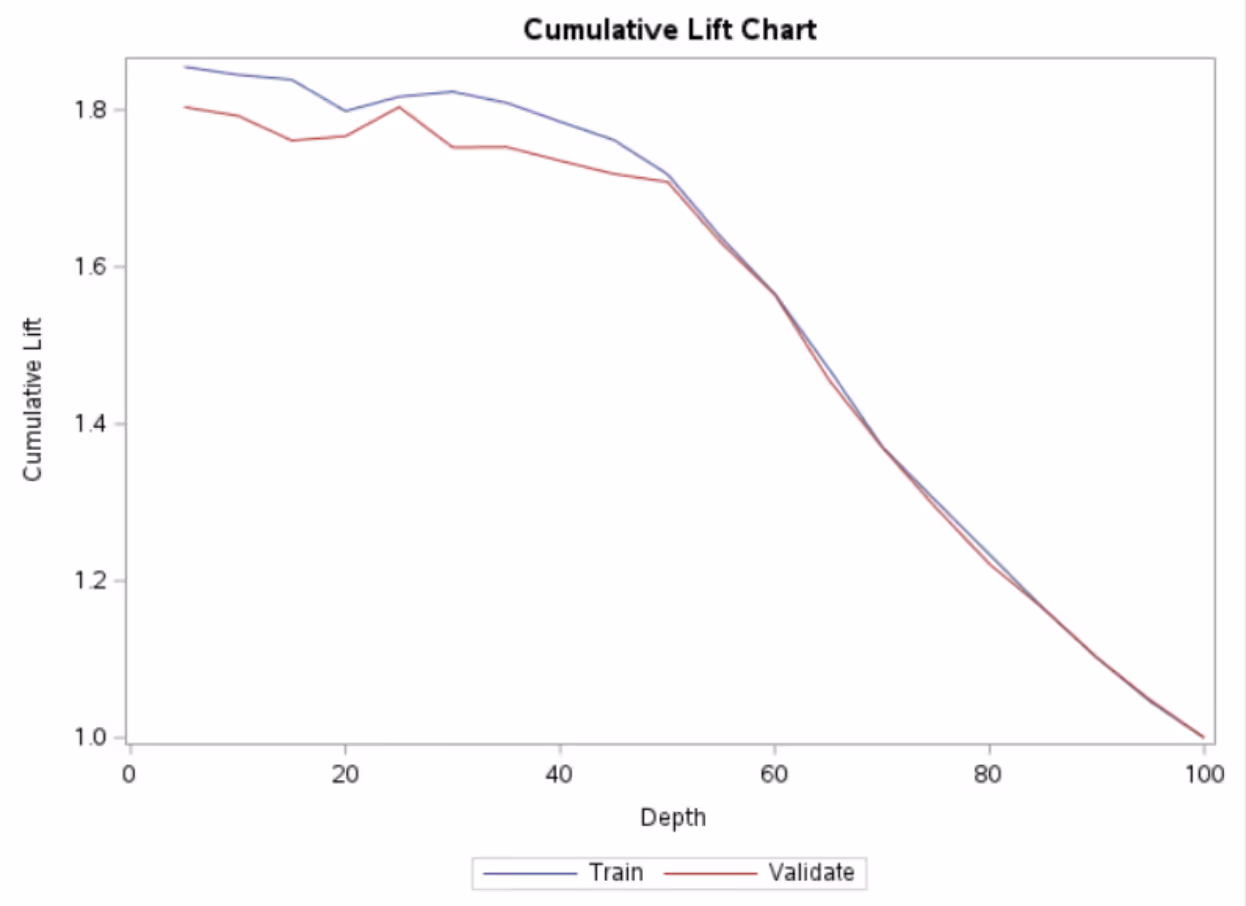
The model is effective at identifying positive cases in the top 10-20% of the population, achieving a lift of around 1.8.
Logistic regression: Maximum likelihood estimates
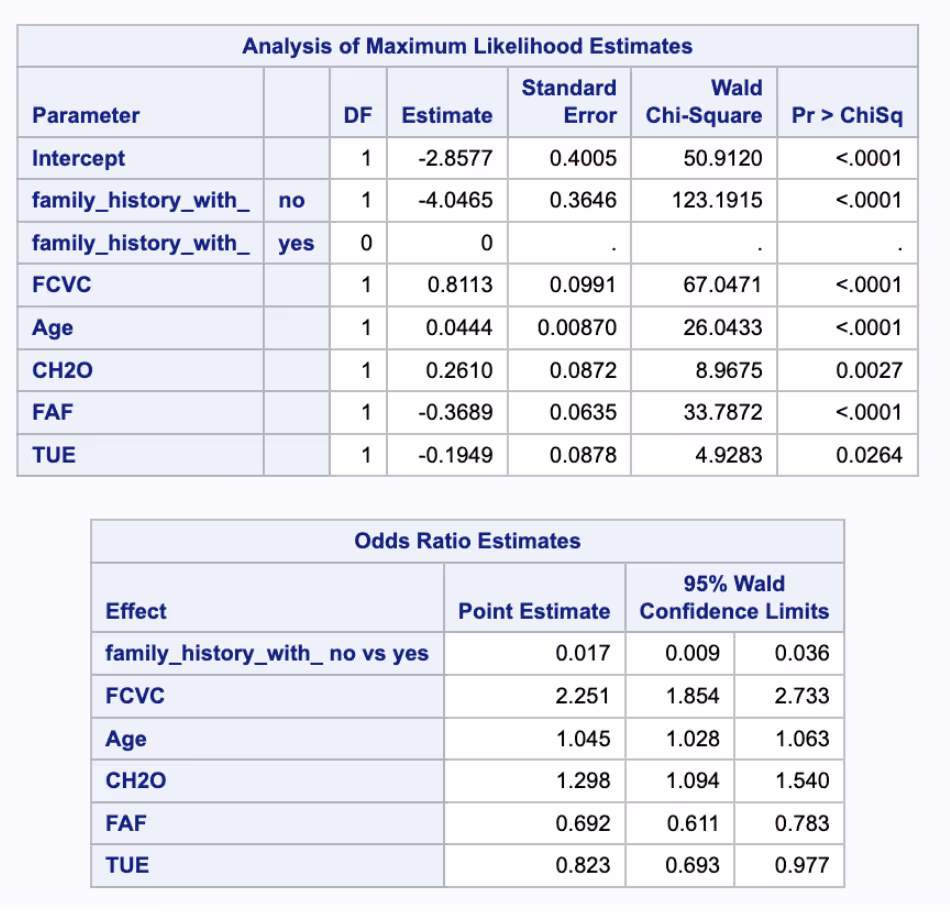
Family history of obesity is the most significant predictor, with a very strong association. Vegetable consumption (FCVC) shows a positive relationship with obesity, which might warrant further exploration as it could be masking other dietary behaviors. Physical activity has a protective effect, reducing the odds of obesity. Age and water consumption also slightly increase the odds of obesity, while technology use during eating shows a modest reduction in obesity likelihood.
Phase 5: Neural network and optimization
To enhance the efficiency and scalability of Phases 1-4 for future projects, we're developing a custom neural network hosted on a high-performance Google Cloud instance. This setup ensures rapid processing and adaptability for large datasets, enabling us to analyze complex variables with speed and accuracy.
Additionally, we are creating custom PROCs to streamline common SAS programs, significantly reducing our time-to-analysis and making our approach both agile and reusable for similar applications. These optimizations position us to deliver data-driven insights faster and more effectively in future studies.


Case study
Uncovering the drivers of rental real estate premiums with Airbnb data
We conducted an in-depth analysis of historical rental listing data to uncover strategies for optimizing investment decisions and profitability in the short-term rental market. Our work identified key property attributes and neighborhood characteristics that drive returns.
We created a software tool to help investors refine pricing strategies and maximize revenue potential for their short-term rental properties.
Phase 1: Data collection
Phase 1 establishes our goal to identify neighborhoods and property configurations in Los Angeles County that maximize short-term rental profitability.
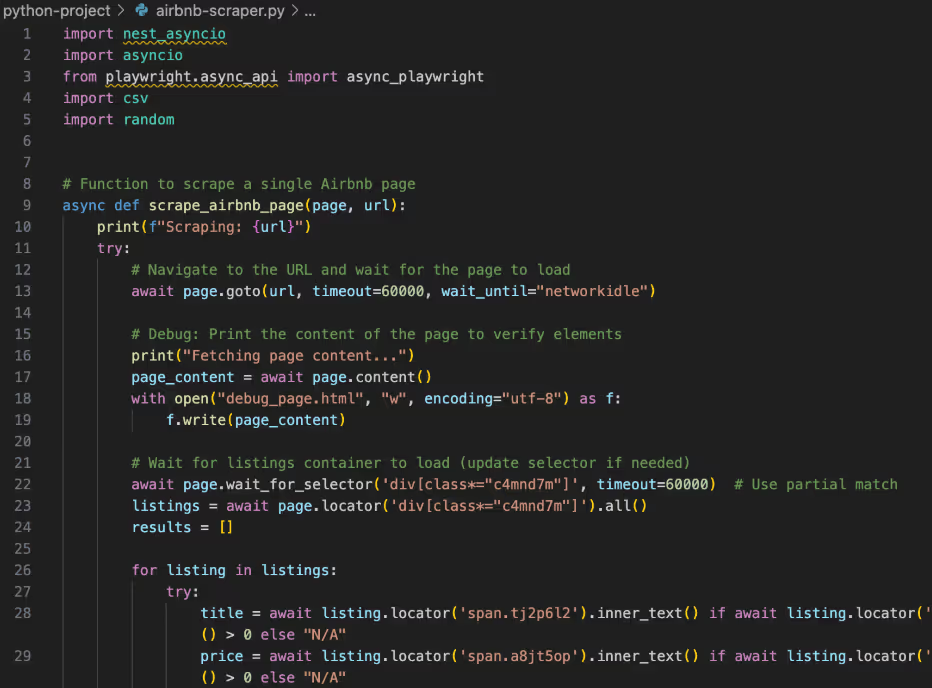
To accomplish this goal, we wrote Python code to scrape the Airbnb website for historical listing data. We then ran geographical data comparisons and correlation analysis to understand the key drivers of rental profitability.
Dataset collection
We compiled a dataset of 24,657 Airbnb listings enriched with ZIP code and economic data, addressing missing values, typos, and outliers.
Independent variable definition


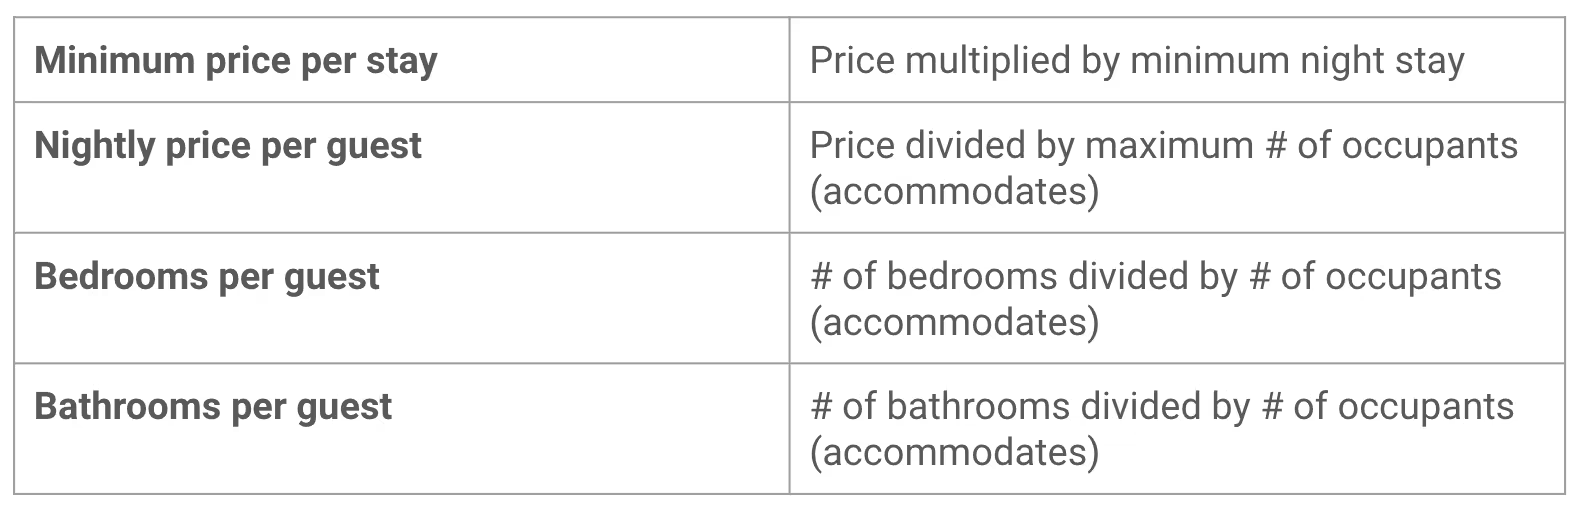
Calculated variable definition
Phase 2: Analysis and model creation
In phase 2, we analyzed 24,657 Airbnb listings in Los Angeles County to uncover data-driven strategies for maximizing profitability in the short-term rental market. We identified key factors influencing rental price, including property size, neighborhood income levels, and amenities, while leveraging regression, ANOVA, and logistic models to validate insights.
The analysis led to the development of a software tool and dashboard that provide investors with actionable recommendations to optimize pricing, enhance rental performance, and identify high-ROI opportunities. These outcomes empower property owners to make informed investment decisions, improve profitability, and stay competitive in a dynamic market.
Phase 2 outcomes
Goals & Approach: We aimed to prioritize neighborhoods and property configurations offering the highest ROI. Using advanced analytics, including regression models and ANOVA, we examined key property features and neighborhood characteristics to uncover actionable insights.
Key insights
- Larger properties with more bedrooms and bathrooms consistently command higher prices.
- Premium neighborhoods, such as Malibu, yield significantly higher average rents, while areas like Wrightwood offer budget-friendly options.
- Amenities, rental length, and room type influence pricing strategies and guest preferences.
Data analysis highlights
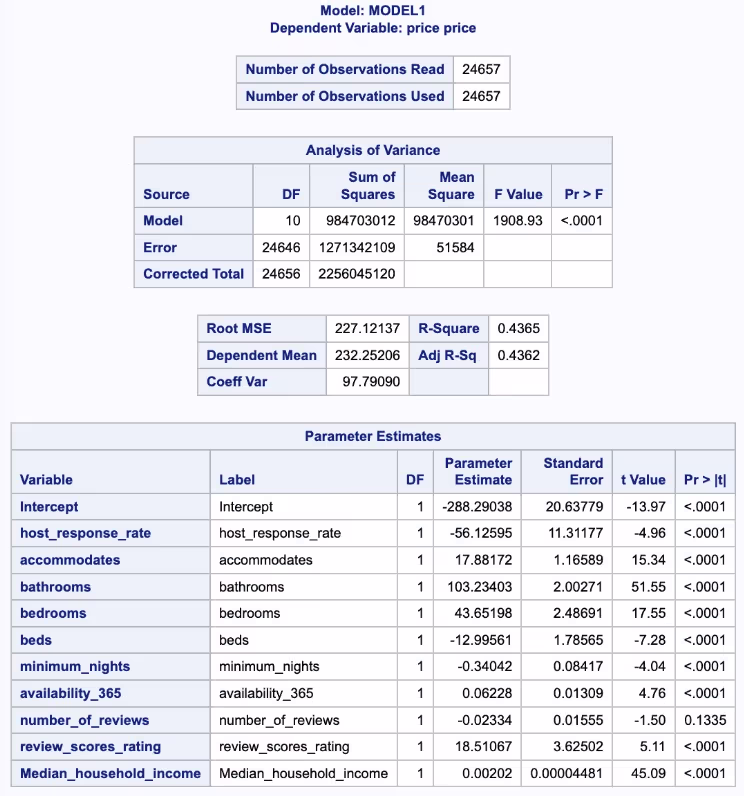
- Regression analysis revealed strong correlations between rental price and property size, income levels, and other features, achieving an R² of 0.43.
- ANOVA and logistic regression models provided deeper insights into the interaction of categorical variables, such as room type and rental length, on pricing.
- ROC curves and predictive modeling validated the high accuracy of our luxury property classification model.

Tools and deliverables
- A custom-built software tool integrates these insights, enabling investors to optimize property performance, adjust pricing, and identify high-ROI opportunities.
- We developed a dashboard to visualize data trends, enhance decision-making, and support ongoing analysis.
Impact and recommendations
Investors can use these insights to make data-driven decisions about property acquisitions, upgrades, and pricing strategies. Targeted recommendations for optimizing rental performance include focusing on underperforming properties and tailoring amenities to market demands.
We deliver precise, actionable insights that turn complex data into a tool for strategic growth.
